Visualizing shared budgets and dividing up household expenses fairly
My partner and I have been tracking our finances ever since we moved in together back in 2014. Originally, we started just tracking our shared expenses like rent and groceries in order to make it easier to divide our household contributions *fairly* (for more, check out the post on our Marriage Constitution).
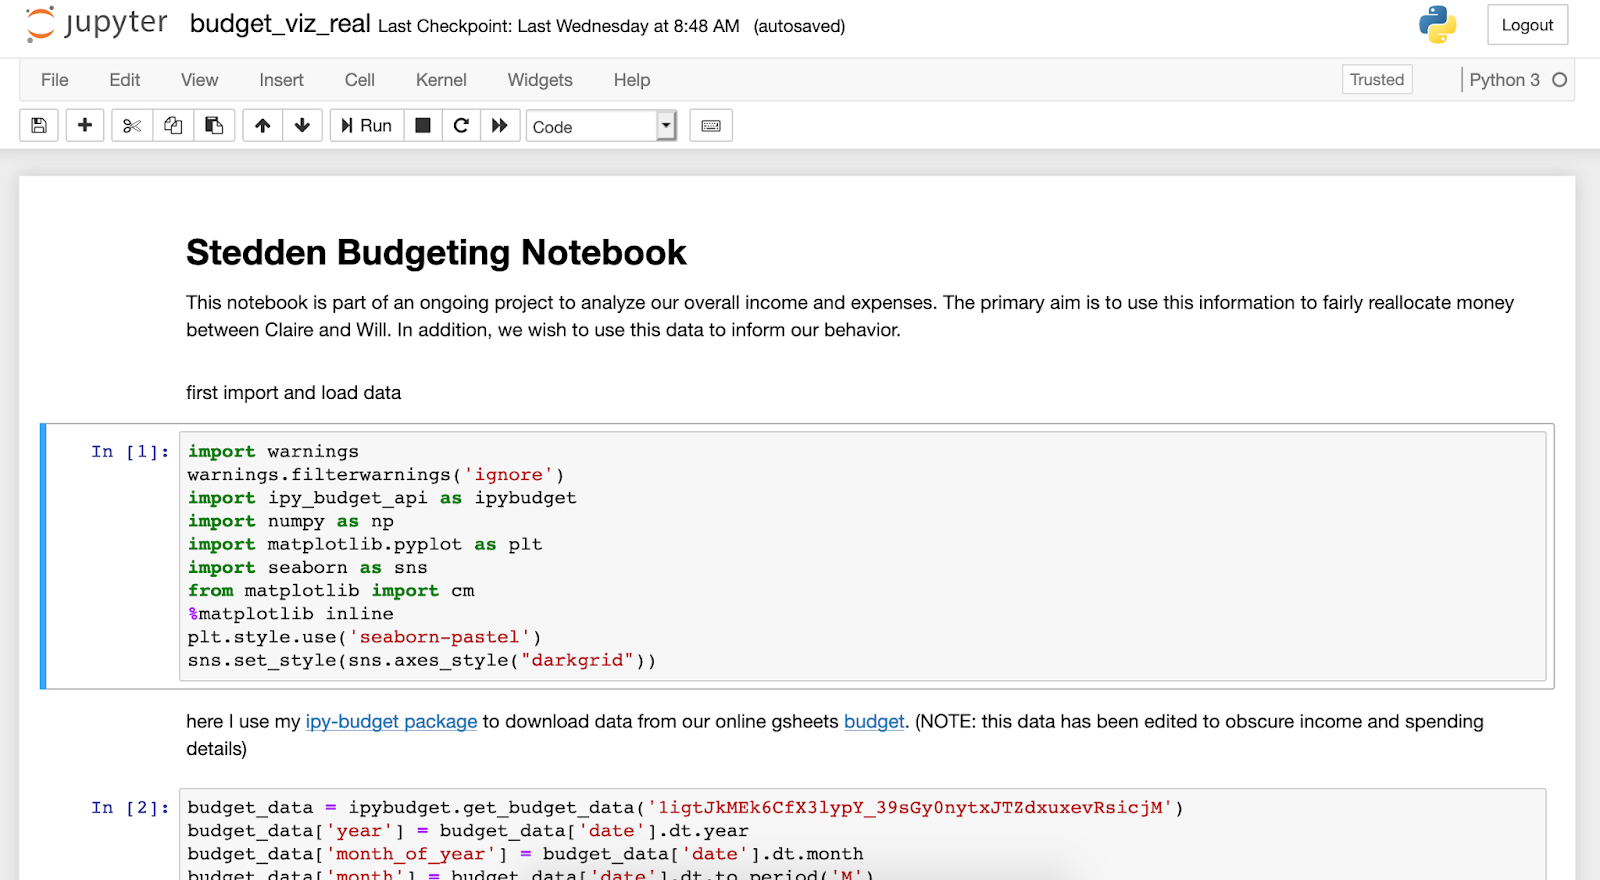
Figuring out how much we each owed was easy when Claire and I earned the same graduate student stipend and lived in the same place, but eventually we started to have time varying incomes and a more complex expense structure. It was starting to get tricky to sort out who owes what. To solve this, we came up with a more sophisticated way to track and visualize how much we earn and spend. I ended up writing some analysis code into a simple jupyter notebook along with a python package for refreshing the data from our records on Google Sheets.

The code is available on the lots-of-things GitHub, and I made some dummy budget data on Google Sheets. Read on for more details and background.
The Theory
With our budget, my partner and I are trying to experiment with a small-scale semi-utopian economy. Economics is interesting to me because I love the concept of quantizing the costs and benefits of our choices. Of course, money is an imperfect way to quantify all the multitude of factors that go into our definition of value, but I do fundamentally prefer imperfect metrics to fuzzy subjective definitions of value, particularly when trying to define fairness of value in a multi-party situation. I've always thought that keeping things qualitative gives unfair advantage to those who can argue eloquently (or whine loudly). Since I'm interested in an experiment with small organization economics, it's really useful to have a system in place to track, analyze, and experiment with our financial data on the finest grain we can.
Overview of expenses and income
When we were first getting started we were only interested in categorizing our expenses into shared and separate to know who was paying for what out of their own pocket. However, we quickly realized that since we were doing all this categorization anyway, it would be really useful to label our expenses a little more granularly so we could analyze what our spending habits looked like over time.
Over time, we started incorporating more detail to bin our expenses into the following categories:
- income - gross income from our employers or any side-hustles
- rent - our primary housing related expenses and some utilities
- groceries - any essentials bought from the market, includes alcohol purchases from the store
- household - broader category for non-food but still fairly essential things around the house
- recreation - broad category for things we did just for fun, eating and drinking out, throwing parties, etc
- medical - insurance and medical bills
- transit - public transit and rideshares
- car - gas, insurance, repairs
- boat - boat purchase, slip fees
- flights - any airfare (excludes frequent flier miles though)
- donations - charitable organizations
- gifts - things we buy to give to others
- wedding - separate category for all of our wedding expenses
- work expenses - things we buy to do our work, often reimbursed
- taxes - tracking tax withholdings and refund
In addition, we have two more that are a little different than normal income/expenses. I'll talk more about these categories later and our debate in how to think about them.
- investments - treating investments like an expense that will have a future return (hopefully)
- redistributions - transfers from one party to another to help even out the burden
At the time when we first started tracking all these categories, it seemed like overkill, but now, years later, I'm glad we did it. This lets us uncover some neat insights into how our spending in each category changed over time. As an example, here we could see our spending on airfare.

This started to climb in late 2016 when I moved out to California, and we started flying back and forth constantly. It should drop down to nearly zero this year as we start to get our flying habit back under control. We can view this same sort of figure across many different categories of spending too.

One thing that these plots point out is that the spending is not uniform between Claire and myself. Normally, Claire ends up spending a lot more than me. This isn't because Claire is going on shopping sprees or anything; she just ends up taking on a greater proportion of the household and grocery spending. This brings us to the next topic: redistributing money to make up for differences in expenses.
Splitting Expenses
As mentioned above, a key reason for doing all this is to determine a fair way to divvy up our money based on income and spending. We've heard that money arguments can lead to failed relationships so we wanted to preempt the arguments by coming up with a reasonable way to discuss things and make fair decisions.
Why not just divide evenly?
A lot of couple's seem to suggest the "put equal amounts into a shared account method." I don't think that method is really adequate for two reasons. First, I think that the person who makes more money should have to pay more of the expenses. This feels justified because the combined lifestyle should be reflected by the combined income. Splitting evenly would mean either the overall money spent is lower than we can afford OR that the person who makes less will have to allocate more of their money to expenses. Either way this is non-optimal and should be prevented with some differential contribution to the shared coffers.
The second set of reasons are more about why using a bank account is worse than directly monitoring spending. Just blindly dropping money into a shared account is inefficient and can also can incentivize bad actions. If there is leftover shared money, both parties are incentivized to spend it up rather than reallocate it to savings. Also there is an inherent inefficiency if extra money starts piling up in the shared account rather than being reallocated to investment accounts.
So we wanted to come up with a better way to combine our assets, but still keep autonomy and flexibility.
From each according to his ability, to each according to his needs
The most reasonable method we could come up with was to split our expenses based on our proportion of income. This method makes perfect sense both in the limit where one person is making all the money and when everyone makes the same amount. And it seems like the most reasonable starting place for a fair division.
Initially, we figured it would be easy to just add up our monthly or quarterly income along with our expenses and divide evenly. However, a simple thought experiment shows why it makes more sense to use our cumulative income and expenses.
The Lottery
Imagine that in a relationship, one partner makes all of the money, while both partners spend about the same amount month to month. Clearly, the partner that makes all the money needs to reimburse the other or else the non-earning partner will not have any money to spend! That is just fair. Now imagine that the non-earner were to buy a lottery ticket and win a million dollars on one day. If they were basing their split on that month then clearly the lottery-winner/normally-non-earner would have to pay for almost everything that month. However, compared to the monthly expenses their would still be tons of cash left over, which the non-earner would get to bank at the end of the month. Then, the next month the non-earner's income would go back to zero, and the earning partner would have to go back to supporting both parties. Clearly this would be unfair. A similar argument explains the unfairness if the couple have time-varying expenses too. Hence, it is more fair to divvy up the total cumulative expenses based on the partners cumulative income.
This might not be a huge difference in practice though, so it made sense to compare the two methods using our real data.
Local vs Global Income and Expenses
I wanted to compare the method of using the short-term (local) and cumulative (global) expenses and incomes for the split of money. Because I already have all the data in an unaggregated form, it's easy to use pandas to get a cumulative sum of the expenses.
income['total quarterly income'] = income['c']+income['w']
income['total cumulative income'] = income['total quarterly income'].cumsum()
income['Claire\'s local share of income'] = income['c']/income['total quarterly income']
income['Claire\'s global share of income'] = income['c'].cumsum()/income['total cumulative income']
As a first step, we can plot these two methods of breaking down our income. In the graph below, I plot the share of our total income that Claire brought in as a proportion of our total. We expected that we'd look roughly equal up to the start of 2017 and then Claire would make up about one third of the income.

That turns out to be the case for the local method, but for the global method she slowly shifts from 50% toward ~30%. This smooths out the step change in my income because over a long enough time, fluctuations in income become less important.
In Q1 2019, Claire stopped working as she transitioned between grad school and her first job. Clearly with the local method, Claire's income drops to zero, and so her share of expenses should be zero. However, using the global method, her income in prior periods still counts, though less and less over time.
Similarly our local split of expenses zig-zags also all over the place, but that is smoothed out in the global method.

So with the aggregated income and expense data, we can calculate what we each should have paid and what we ended up paying.
Calculating the overpayment
Using the local and global methods, I can calculate the fair allocation of Claire's expenses by multiplying Claire's fair share of expenses by the true expenses. I can then perform another cumulative sum to see the gap between what Claire has really paid to date and what she should have paid. Finally, the difference between those lines is the overpayment by Claire (ie the money I owe her).

Right around the beginning of 2017 was the last time that Claire and I redistributed money. It was also when I started my post-grad job and started earning more. You'll notice that the global method actually means Claire is owed more money from me. It comes to about $1000 dollars which is real money. I guess that's what I get for trying to do things more fairly!
Counting Investments?
One thing that we are still trying to figure out is how investments should be tracked. There are basically two ways to think about them.
- Ignore investments - Investments are really just moving your income around between accounts
- Investments as expenses - Investments are treated as expenses until they are withdrawn
It's hard to decide which way to think about investments. I personally like the idea of thinking about them as current expenses. This makes investments similar to other large capital purchases that might pay off later. For example, buying a car means an expense today with a possible payout later (though less than the initial value probably). Investments are just the same except that they can earn more money.
The issue is that then all one partner has to do is invest all of their money to make it look like they have no income. That could lead to bad behavior, but realistically, the same could be said for any expenses (spending all your money on things that go to yourself means you don't have to share anything). The point of the budget is to identify where one partner is over-spending or over-investing and to allow a debate about whether that is wise. Importantly, if one partner makes a bad investment they probably shouldn't be penalized by having to count the investment as their personal income without being able to count the loss. Furthermore, either partner can decide that they want to take on investing more money and there can be a redistribution of income to compensate. It all just comes down to a negotiation and an ability to justify the expense for the good of the team.
This, to me is the argument for treating investments like normal expenses until withdrawn. However, Claire and I still need to work out whether that is a reasonable way to think about it.
Conclusion
In the end, all of this just goes to remind me how lucky I am that I've been able to have stable finances in my adult life. Going through this exercise was really important for seeing how our spending habits are evolving as our lifestyle changes, and it's been useful in articulating our goals for our financial future. We will continue to use this method to redistribute income in the future, and I will update if we arrive at any new methodologies that are worthy of note. I can also see this paradigm working in a larger coop-like organization, and I'm curious to see if Claire and I ever get to incorporate these ideas into something like that.
Appendix: Securely querying Google Sheets data in python
One of the things that made this so easy was the ability to get the data out of google sheets and into a jupyter notebook where we could more cleanly perform the analyses we needed for this project. It would have been very messy to do all this work directly in the spreadsheet. Many others have found this separation of data entry and front-end/analysis to be really effective too.
I also built a little wrapper python package for the gsheets api that is specifically designed for grabbing data in this format. The package calls up the Google Authentication flow to securely allow connection to your own GSheets. This greatly reduces friction from downloading and manually storing files all over.
If you like this project and want to replicate the workflow for yourself feel free to fork the repo and make modifications. I could imagine this could be a start to a really lightweight DIY budgeting analysis toolkit. In future editions I hope to build some piping for automated download of financial statements and import into gsheets and maybe even auto classification and analysis. This seems really preferable to shopping this out to a third party like mint for the security and privacy reasons.
 will stedden

